Ontario History
|
These graphs show the recent history of child protection in Ontario. The figures came from statistics posted on the web by the Ontario Association of Children's Aid Societies. Where data is no longer on the web, a blank bar appears. | ||||||||||||||||||
| 91 | 92 | 93 | 94 | 95 | 96 | 97 | 98 | 99 | 00 | 01 | 02 | 03 | 04 | 05 | ||||
|
Expenditures Data is for calendar year through 1998, and for year ending March 31 of the following year thereafter. Before 1999 the province and municipalities shared the expense, thereafter the province funded 100%. The left and right bars represent $418 and $1242 million. | ||||||||||||||||||
| 91 | 92 | 93 | 94 | 95 | 96 | 97 | 98 | 99 | 00 | 01 | 02 | 03 | 04 | 05 | 06 | 07 | 08 | 09 |
|
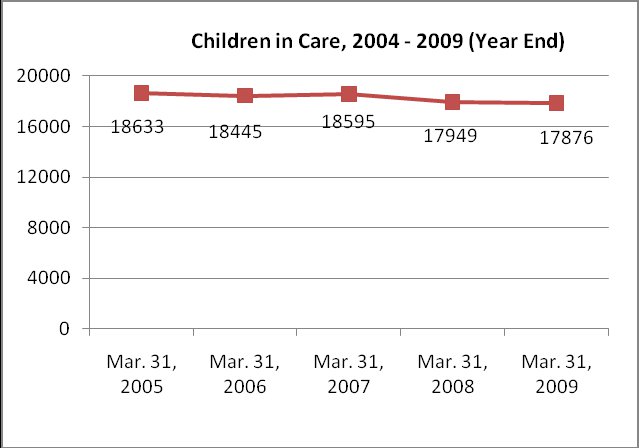
Children in care
Figure is for the beginning of the year to 1998, and for March 31 of later years. The left and right bars represent 10385 and 18668 children. | ||||||||||||||||||
| 91 | 92 | 93 | 94 | 95 | 96 | 97 | 98 | 99 | 00 | 01 | 02 | 03 | 04 | 05 | 06 | |||
|
Staff
Figure is for the beginning of the year to 1998, and for March 31 of later years. The left and right bars represent 4025 and 8357 staff. | ||||||||||||||||||
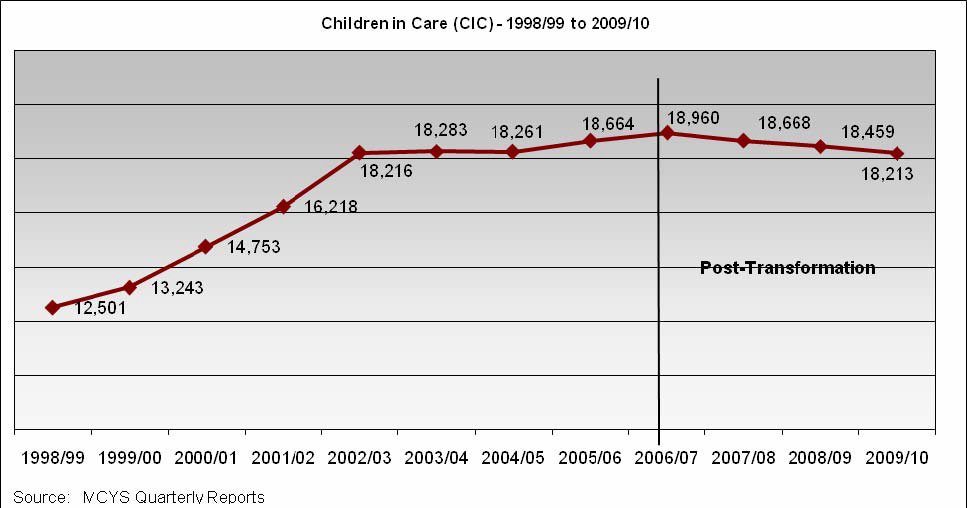
Below is a table published by the OACAS in its document 2010 – 11 Pre-Budget Consultation Submission to the Standing Committee on Finance and Economic Affairs (link, pdf).
OACAS slightly changes its numbers between publications. The figures in the chart differ from year-end numbers in earlier annual reports (used in the earlier bar charts), and the number of child-days of foster care in 2008-2009 in the Pre-Budget Submission is 6,591,822 implying an average 18060 children in care, higher than the chart uses at either end of the year.
From the Commission to Promote Sustainable Child Welfare (pdf).